


Iterating on Your Data Product - Part 3

This is the final post on the Data Product Lifecycle series. For the complete context, go checkout part one and part two.

James Dyson iterated on 5,126 vacuums that didn't work.
Rovio developed 51 games before Angry Birds became a global phenomenon.
Edison tested thousands of materials for the lightbulb filament before finding the right one.
Even WD-40 got its name because its creators failed 39 times—success came with the 40th attempt.

Some of the best products have evolved and iterated multiple times before they reach their full potential, and developing a data product is no different.
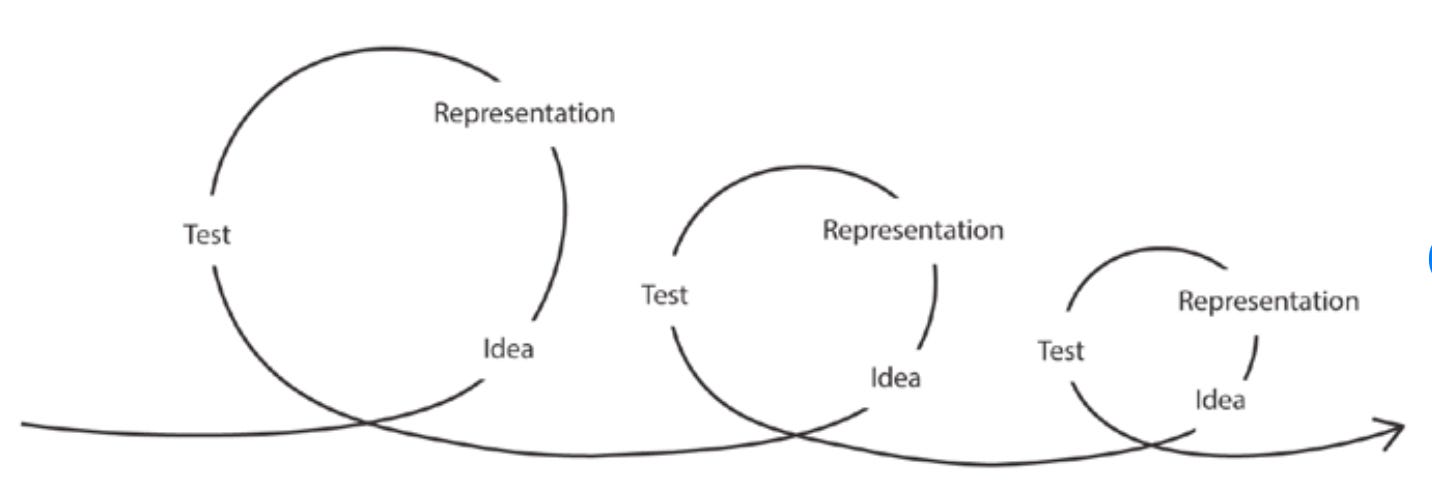
A recurring theme over the last two posts is that data product development is all about iteration. Not just iteration on the entire lifecycle but iteration within phases, and tasks within phases.
Once a data product is shipped to customers, it’s important to open a feedback loop. The feedback loop is critical to ensure iterations are driven by facts and not opinions.
A feedback loop allows you to:
Validate the accuracy of the original business problem.
Confirm original assumptions, benefits, and success criteria.
Identity opportunities to improve the overall product.
Once you collect feedback, it’s expected that you iterate and evolve your data product into something your customer will value even more than the previous iteration.
Why Iteration Matters
Iteration is central to the product lifecycle and as outlined in the above examples, some of the world’s best solutions and ideas come from many cycles of iteration. It’s rare that a solution is formed linearly.
Iteration is essential for several key reasons:
Adapting to change: The world changes fast and as a result, previous assumptions and hypotheses need uplifting.
Value realization: Iteration allows value to be delivered incrementally.
Feedback Loops: Iterating allows feedback loops with stakeholders and customers to be more frequent, thus allowing the data product to evolve and deliver better outcomes.
Cognitive Limitations: Us humans are fragile creations, and we can only process so much at once. Iteration allows for continuous learning and adjustment.
Uncertainty: Not all details are known upfront & even if details are known up front, they are often made up, or incorrect. Iteration enables discovery to be done continuously and allows the problems and benefits to be refined.
Feedback drives iteration
During the first few iterations, it may be obvious on what needs to change or evolve due to obvious issues on the surface. For example:
A business user reported a metric definition was wrong and required a minor tweak.
A model may need to be tweaked due to a noisy feature.
However, eventually, you’ll have to speak to your customers again (just as we covered in part 1) to determine what needs evolving based on the feedback you’ve collected. But how do we know if this feedback is correct? How can we be certain that these new iterations are going to improve the last iteration and deliver on the promised impact?
To answer that, you require a success metric and in the next section we’ll cover how to define a metric and, just like the product itself, evolve it.
Defining Success Metrics
Success metrics track whether your data product is meeting its objective over time, sets teams in the right direction, aligns teams and enables you to easily communicate impact. Success metrics should be aligned to a business objective, which we originally defined on our canvas in part 1.
When defining your metrics, ensure you define them with your stakeholders, business success metrics should not be defined by engineers in a silo.
The metric should be meaningful to everyone. If no one cares about the metric trending in the wrong direction, then it’s not meaningful.
There are plenty of articles out there that can describe what a good success metric looks like, so I’ll be brief and build off SMART.
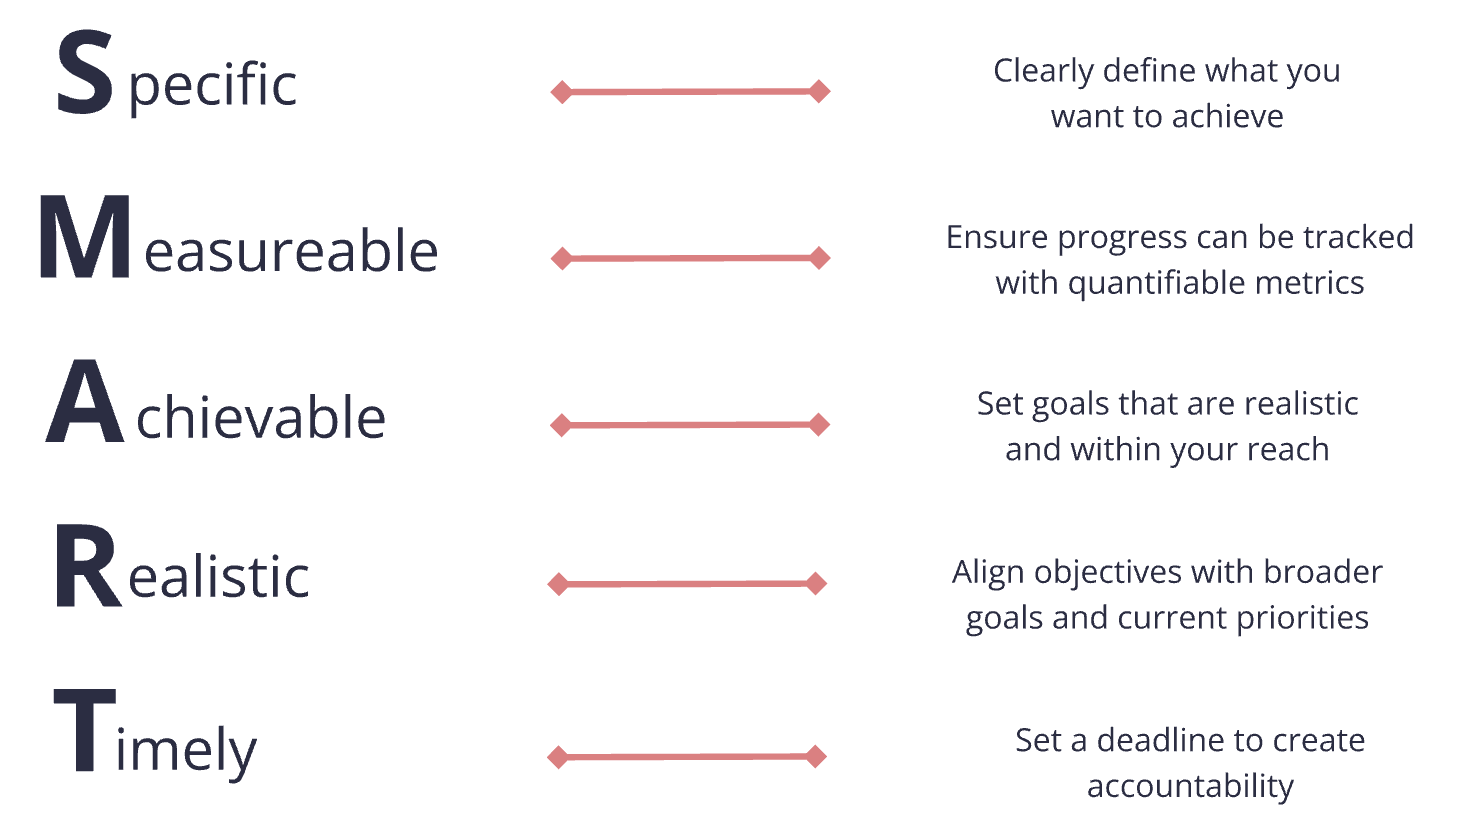
Metrics should be:
Clear and aligned to a business objective.
Trackable with quantifiable metrics (As a data engineer, consider if you even have access to the data, or if it exists.
Realistic and achievable.
Defined with a time horizon to ensure they are reviewed and accountability is established.
Actionable: If a metric is drifting, then an action must be possible to correct its course of action.
Continuously observed, the moment a metric becomes a target, people may focus on manipulating it, rather than seeking meaningful improvements.
"When a measure becomes a target, it ceases to be a good measure" - Charles Goodhart
Metrics are great, and are a fantastic tool to measure progress, but how do you measure if that progress is leading to actual business impact?
Measuring Impact
The success of your data product should be evaluated based on the tangible business outcomes it helps drive. This requires carefully tracking and analysing key metrics that link directly to your organization's strategic objectives. Let’s revisit our GrillTech Burgers company and the original problem. How might this be measured?
Metrics are important, but don’t let them force you into solving the wrong problem too early. Only start considering longterm metrics after discovery and you’ve get a solid hypothesis defined.
Metric Trees to Align Metrics with Objectives
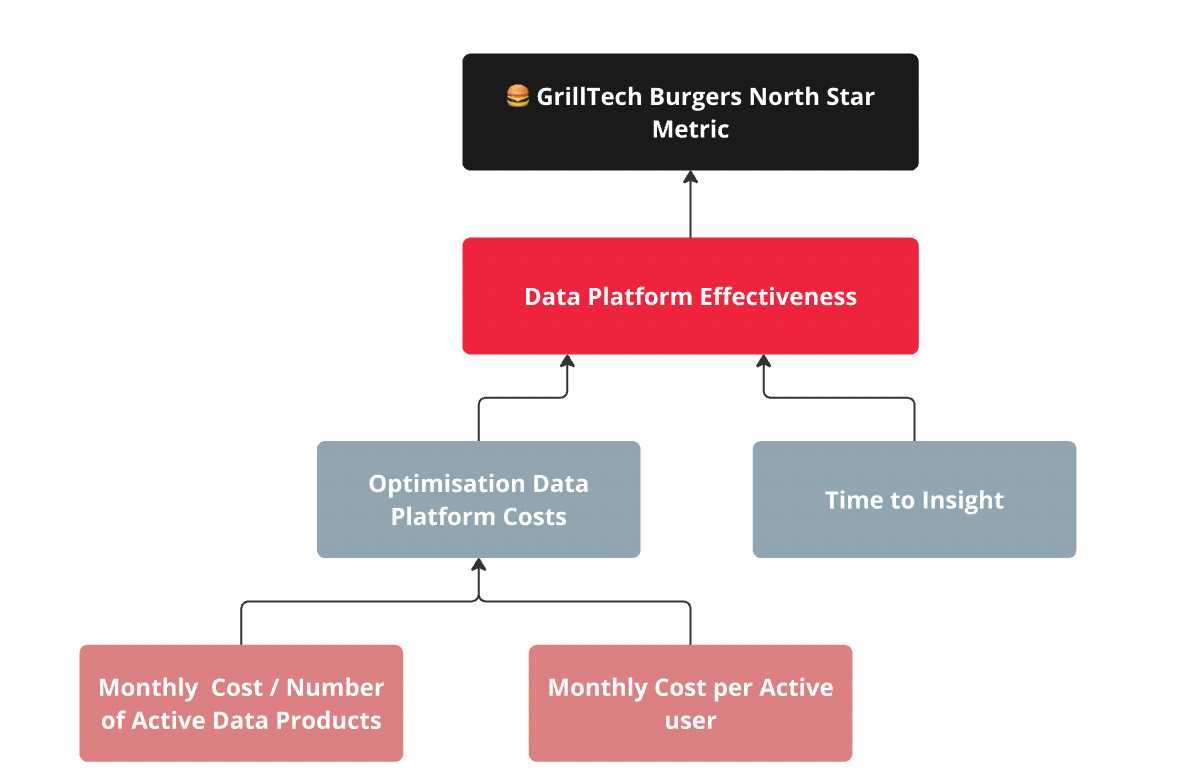
I’m a big fan of metric trees and how they show the relationship between metrics and the overall objective of the organisation. You can read all about metric trees here and here, but in short, metric trees allow you to easily see the causality between metrics and how lower level metrics can influence other objectives and the north star metric.
What might our metric tree look like if we were to develop a data product to solve our 🍔 GrillTech Burgers problem statement?
Understand the impact of your work
As a data engineer, it’s important to understand how the work you are doing contributes to the broader organisation and potentially what metric you are impacting. If you don’t know the answer to this, speak to your team lead. For example, if your team is focused on cost optimization and there's also a goal to increase GrillTech Burgers' profit month-over-month (MOM), your work directly influences that metric.
As Tony Fadell stated in his book “Build: An Unorthodox Guide to Making Things Worth Making”, you should always look up, and look around as an IC.
Look Up: Understand how your work affects company-wide metrics. For instance, when optimizing database performance at GrillTech Burgers, you're not just saving compute costs—you're directly contributing to monthly profit targets.
Look-around: Connect with teams that depend on your data. Understanding their challenges and needs will help you build better data products.
Conclusion
The key to data product success lies in constant iteration. Every phase calls for adjustments, feedback, and improvement. Use feedback as evidence for your iterations, don’t assume you know what your customers want next.
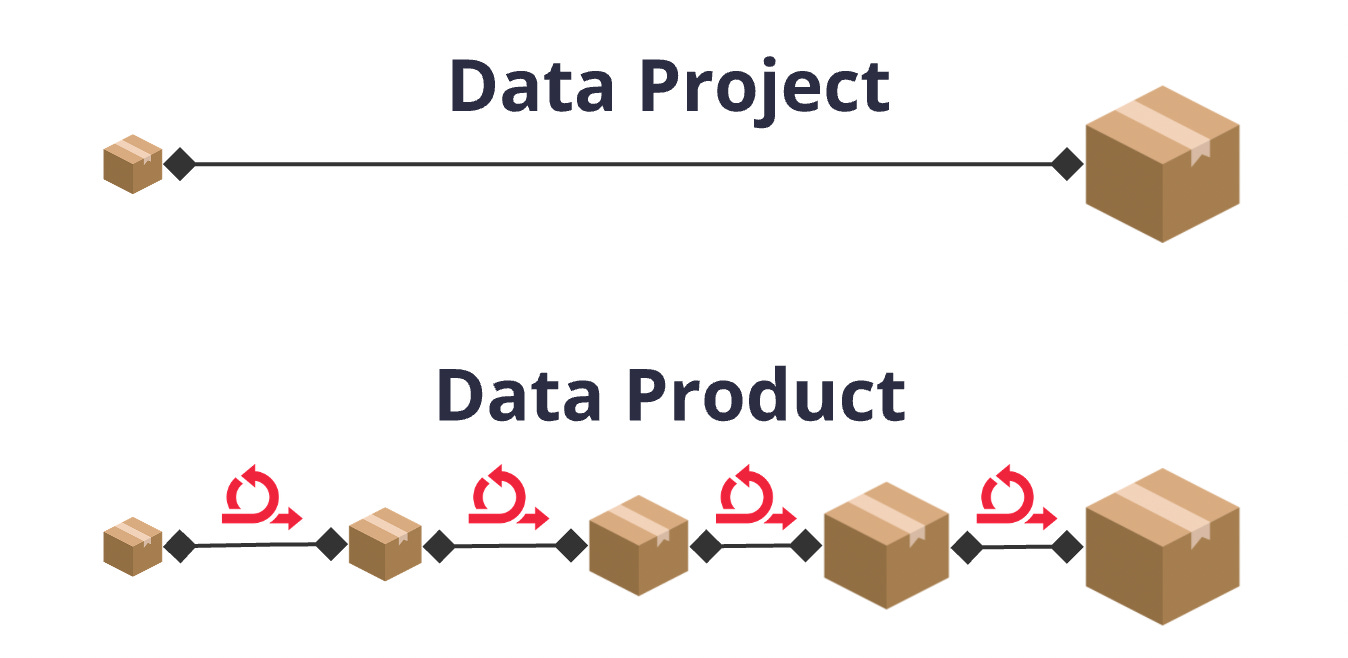
Delivering something once and moving on isn’t a true data product—it’s a data project. To create lasting impact, you must refine and evolve continuously.
Thanks for reading! If you enjoyed this post and the series, consider subscribing below.