


Discovery & Definition: Steps to Shape Successful Data Products - Part 1
Uncovering needs and framing problems in the early stages of Data Product development does not need to be hard!

Welcome to part one of the Data Product Lifecycle Series. Part 1 is all about discovery and definition and is within the problem space. No solutions are defined in discovery.
I want to give some practical examples through the article, so I’ve come up with an example scenario.
🍔 GrillTech Burgers, a gourmet hamburger chain, relies heavily on their Azure Data Platform to manage operations and customer engagement. However, escalating platform costs are impacting profitability, and their Chief Data Officer has urgently requested a solution.
The Data Product Lifecycle
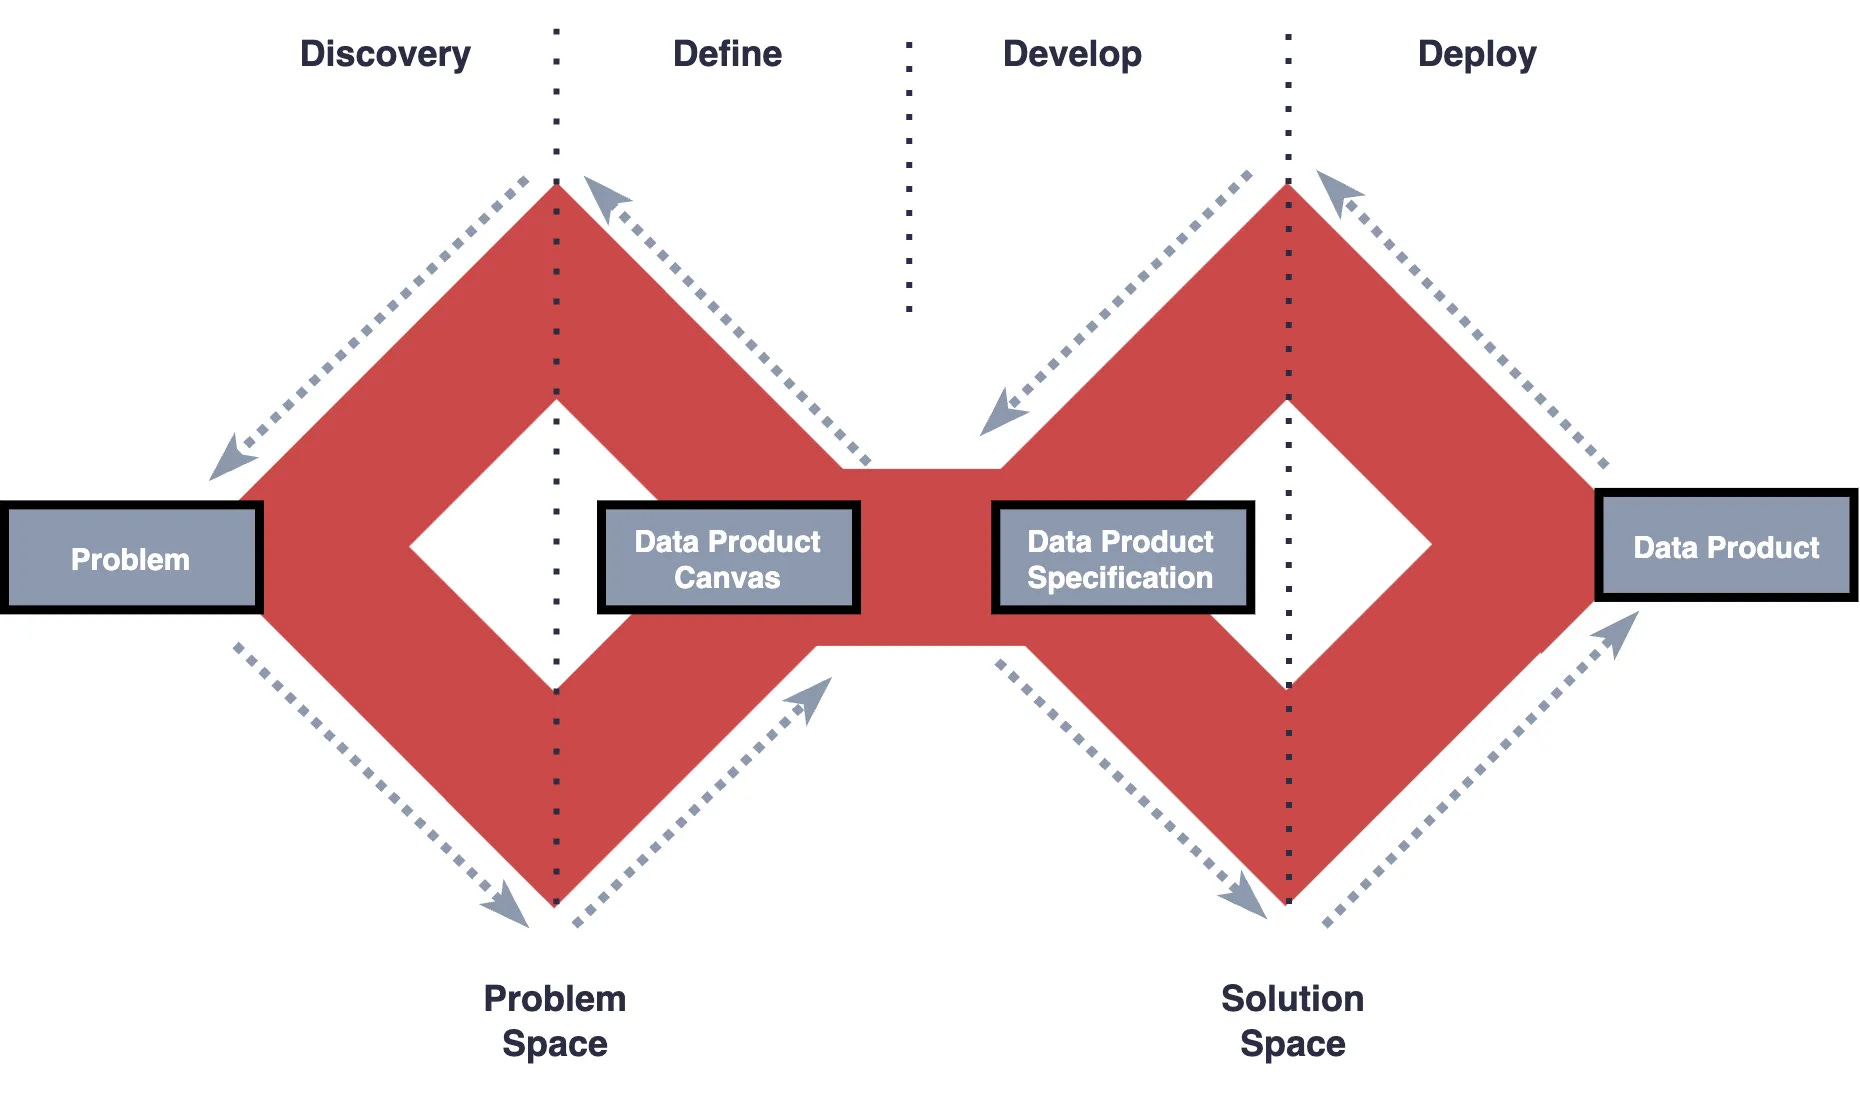
As I mentioned in my initial post, the Data Product Lifecycle (DPL) has been built on top of double diamond framework and tailored for the development of Data Products. The purpose of the DPL is for teams to have a consistent, reliable and scalable blueprint to develop data products that solve the right problems and ultimately deliver undeniable value. Let’s get into it.
Discovery
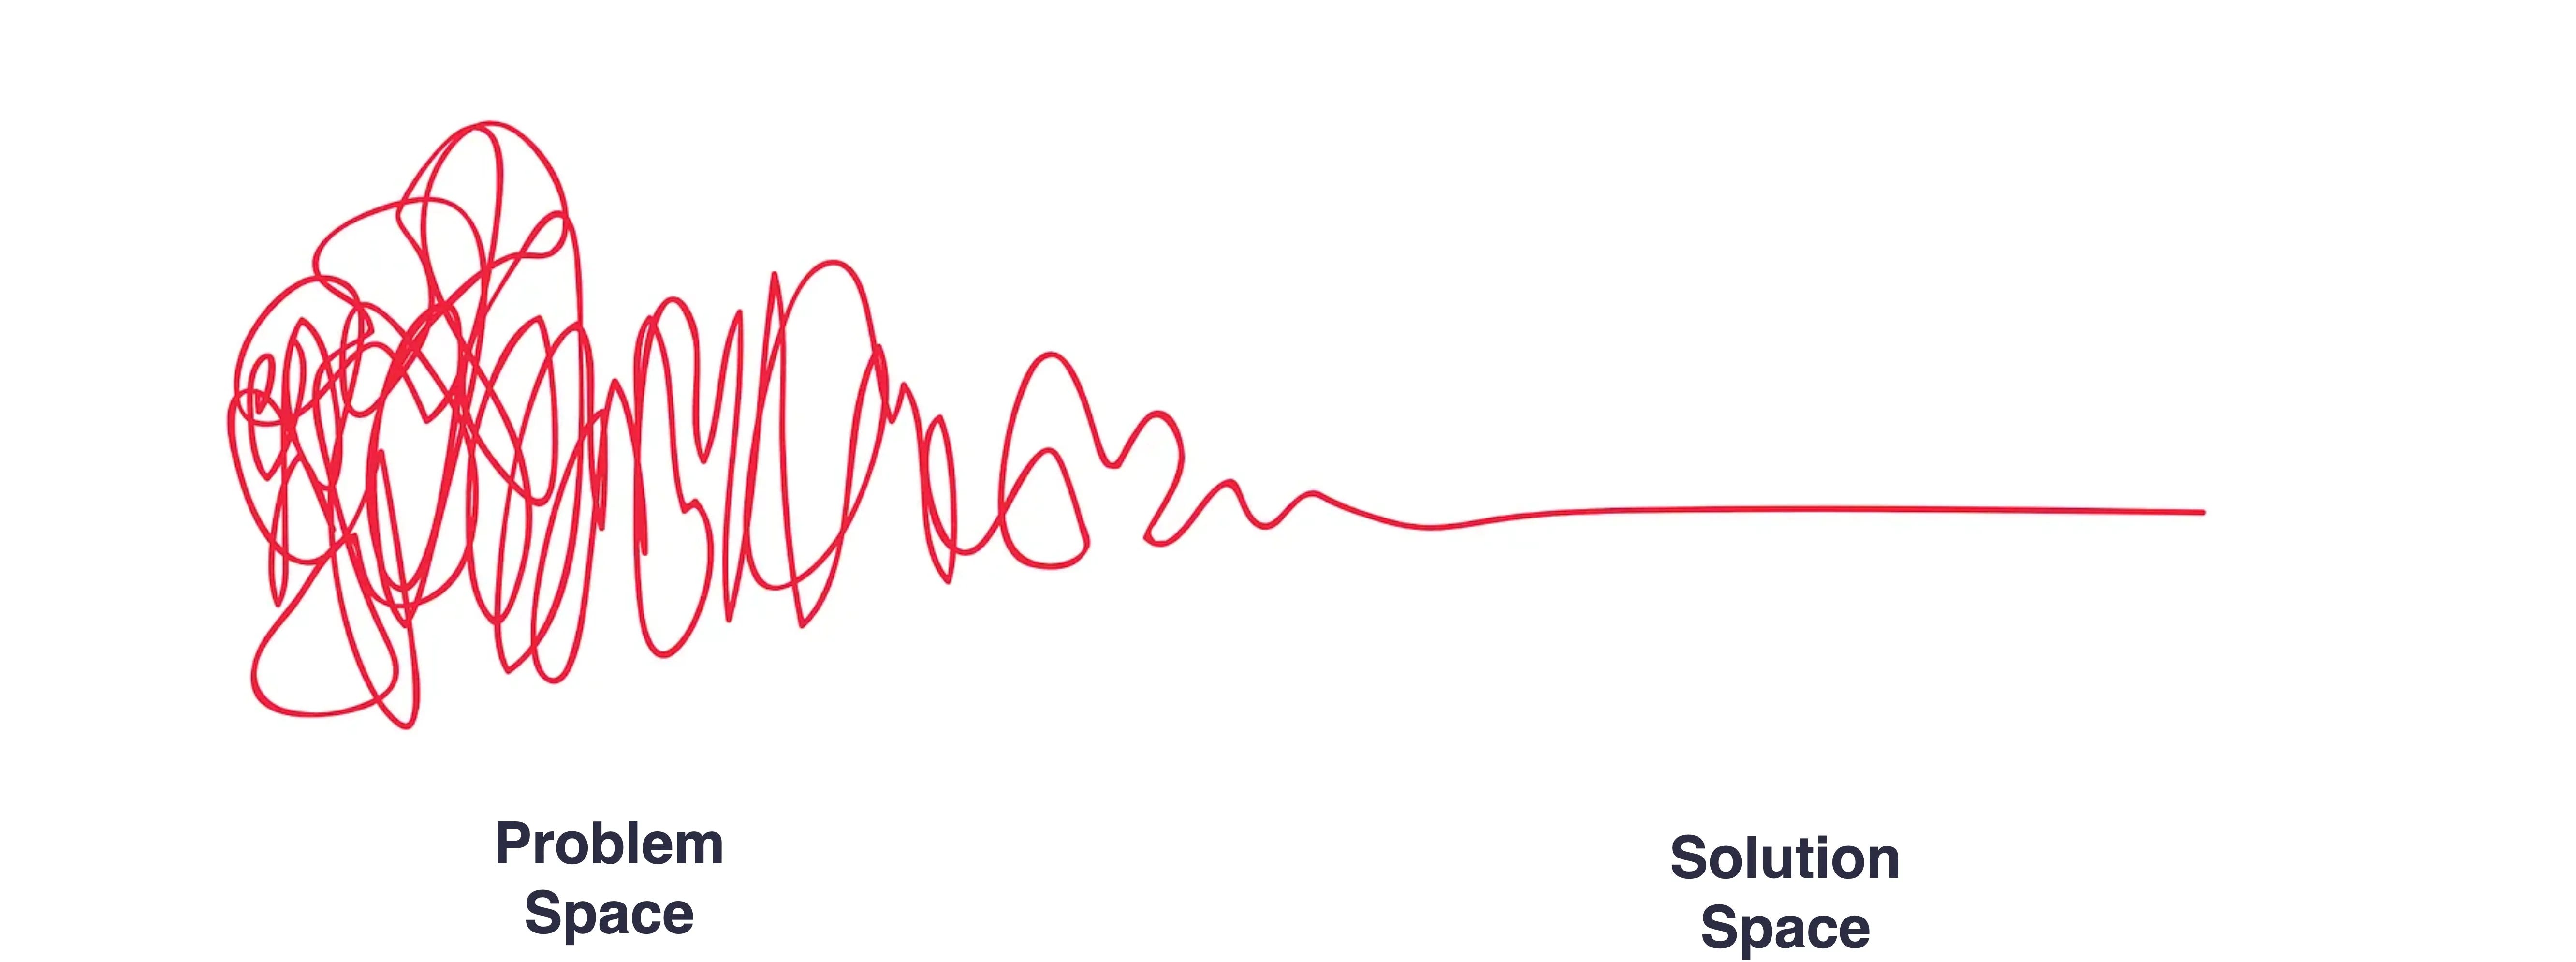
Discovery is all about research, articulating and understanding the problem space, it’s about problem-framing, not problem-solving. Your mental model should be around questioning problems and assumptions.
Do not limit discovery to just identifying requirements and problems, it’s about the final business outcome(s). The outcome is what change you are trying to create. The outcome could be new levers to make better decisions and actions.
I discourage you from focusing purely on requirements as this can sometimes force you to look for problems that those requirements meet versus solving the right business problem (pay attention here, the “right” business problem, not the one you found that addresses a requirement).
This phase is continuous and iterative, to avoid narrowing in on a solution too early. If you are not iterating and changing your problem statement or assumptions, you are highly likely not asking enough question.
Approaching the problem
How you approach the problem is the most important part of discovery. It’s a common fallacy that the problem is ill-defined, people go look for problems or worse, there isn’t even a problem. So how should you start? Start by talking to your customers and understanding their pain points, challenges and needs.
Conducting research and workshops
There are plenty of techniques and workshops you can conduct to ensure you are solving the right problem. There is no right way, and my advice is to experiment. I’ve listed some below you can peruse.
Five Whys: Identify the root cause of a problem. (Solve problems, not symptoms of problems)
Empathy Mapping: Understand the user's feelings, thoughts, and behaviours.
Laddering: Understand the user’s motivations and values (Variant of 5 Why’s)
Journey Mapping: Identify pain points and opportunities across the user's experience.
Value Stream Mapping: Visually represents activities to identify value creation opportunities and problems.
There are a lot more techniques1, but the takeaway is that there is no such thing as asking too many questions and the process is continuous (It’s fine to jump back and forth from discovery and definition). Lastly, “go wide.” Don’t narrow in on the problem statement too soon; it may be the wrong problem.
How do you know you’re asking the right questions?
Better questions, lead to better answers - Someone
Conducting an interview or discovery session can be daunting, and some stakeholders are quite time poor, so ensure you come prepared, and ask the appropriate questions.
Be intentional when you ask your questions, to achieve that, be mindful of the types of answer you are hoping to receive (e.g. don’t ask a business person why compute costs are out of control).
Try to avoid the anti-questions. Some examples below.
Your questions are heavily focused on the solutions and less on the problem/outcome.
Anti-Question: "Would implementing a cost-tracking dashboard help you?"
Better Question: "What specific challenges are you facing in understanding or managing your costs, and how is this impacting your profitability?”
You are asking them what they want, vs what problems/questions they need answering.
Anti-Question: "Do you want us to automate the process of tracking platform costs?"
Better Question: "What data or insights are you currently lacking that would help you control platform costs more effectively?"
Example Probing Questions
Below are some questions you can ask yourself and your customers during discovery, which can help probe more specific questions.
If you had a magic wand, what would you change today?
What outcomes are you expecting?
If you had the data product today, what would you hope it would accomplish?
What actions or decisions will be taken?
Who is using this data product? Do we need to speak to anyone else? (Who are our target users?)
How much money are you willing to spend to solve this problem?
What have you tried before, how do you currently solve this problem? 2
How do you currently solve this problem? (This one is great. Bonus points if follow it up with a Value Chain Mapping exercise)
Can you see a pattern here? Nothing on solutions. There are just boring, timeless questions & techniques that focus on the outcome and not the latest tools or Gartner hype.
The Data Product Canvas
It is time to synthesise and define (and redefine) everything you and your team have gathered during research and discovery into a data product canvas, which will be an input for the solution phase and is a great sensemaking3 tool.
The Data Product Canvas is nothing new. There are lots of different variations and even papers written about the topic. Choose one that works best for you, but the below in my opinion covers the minimin information which i’ve tried to visualise here4.
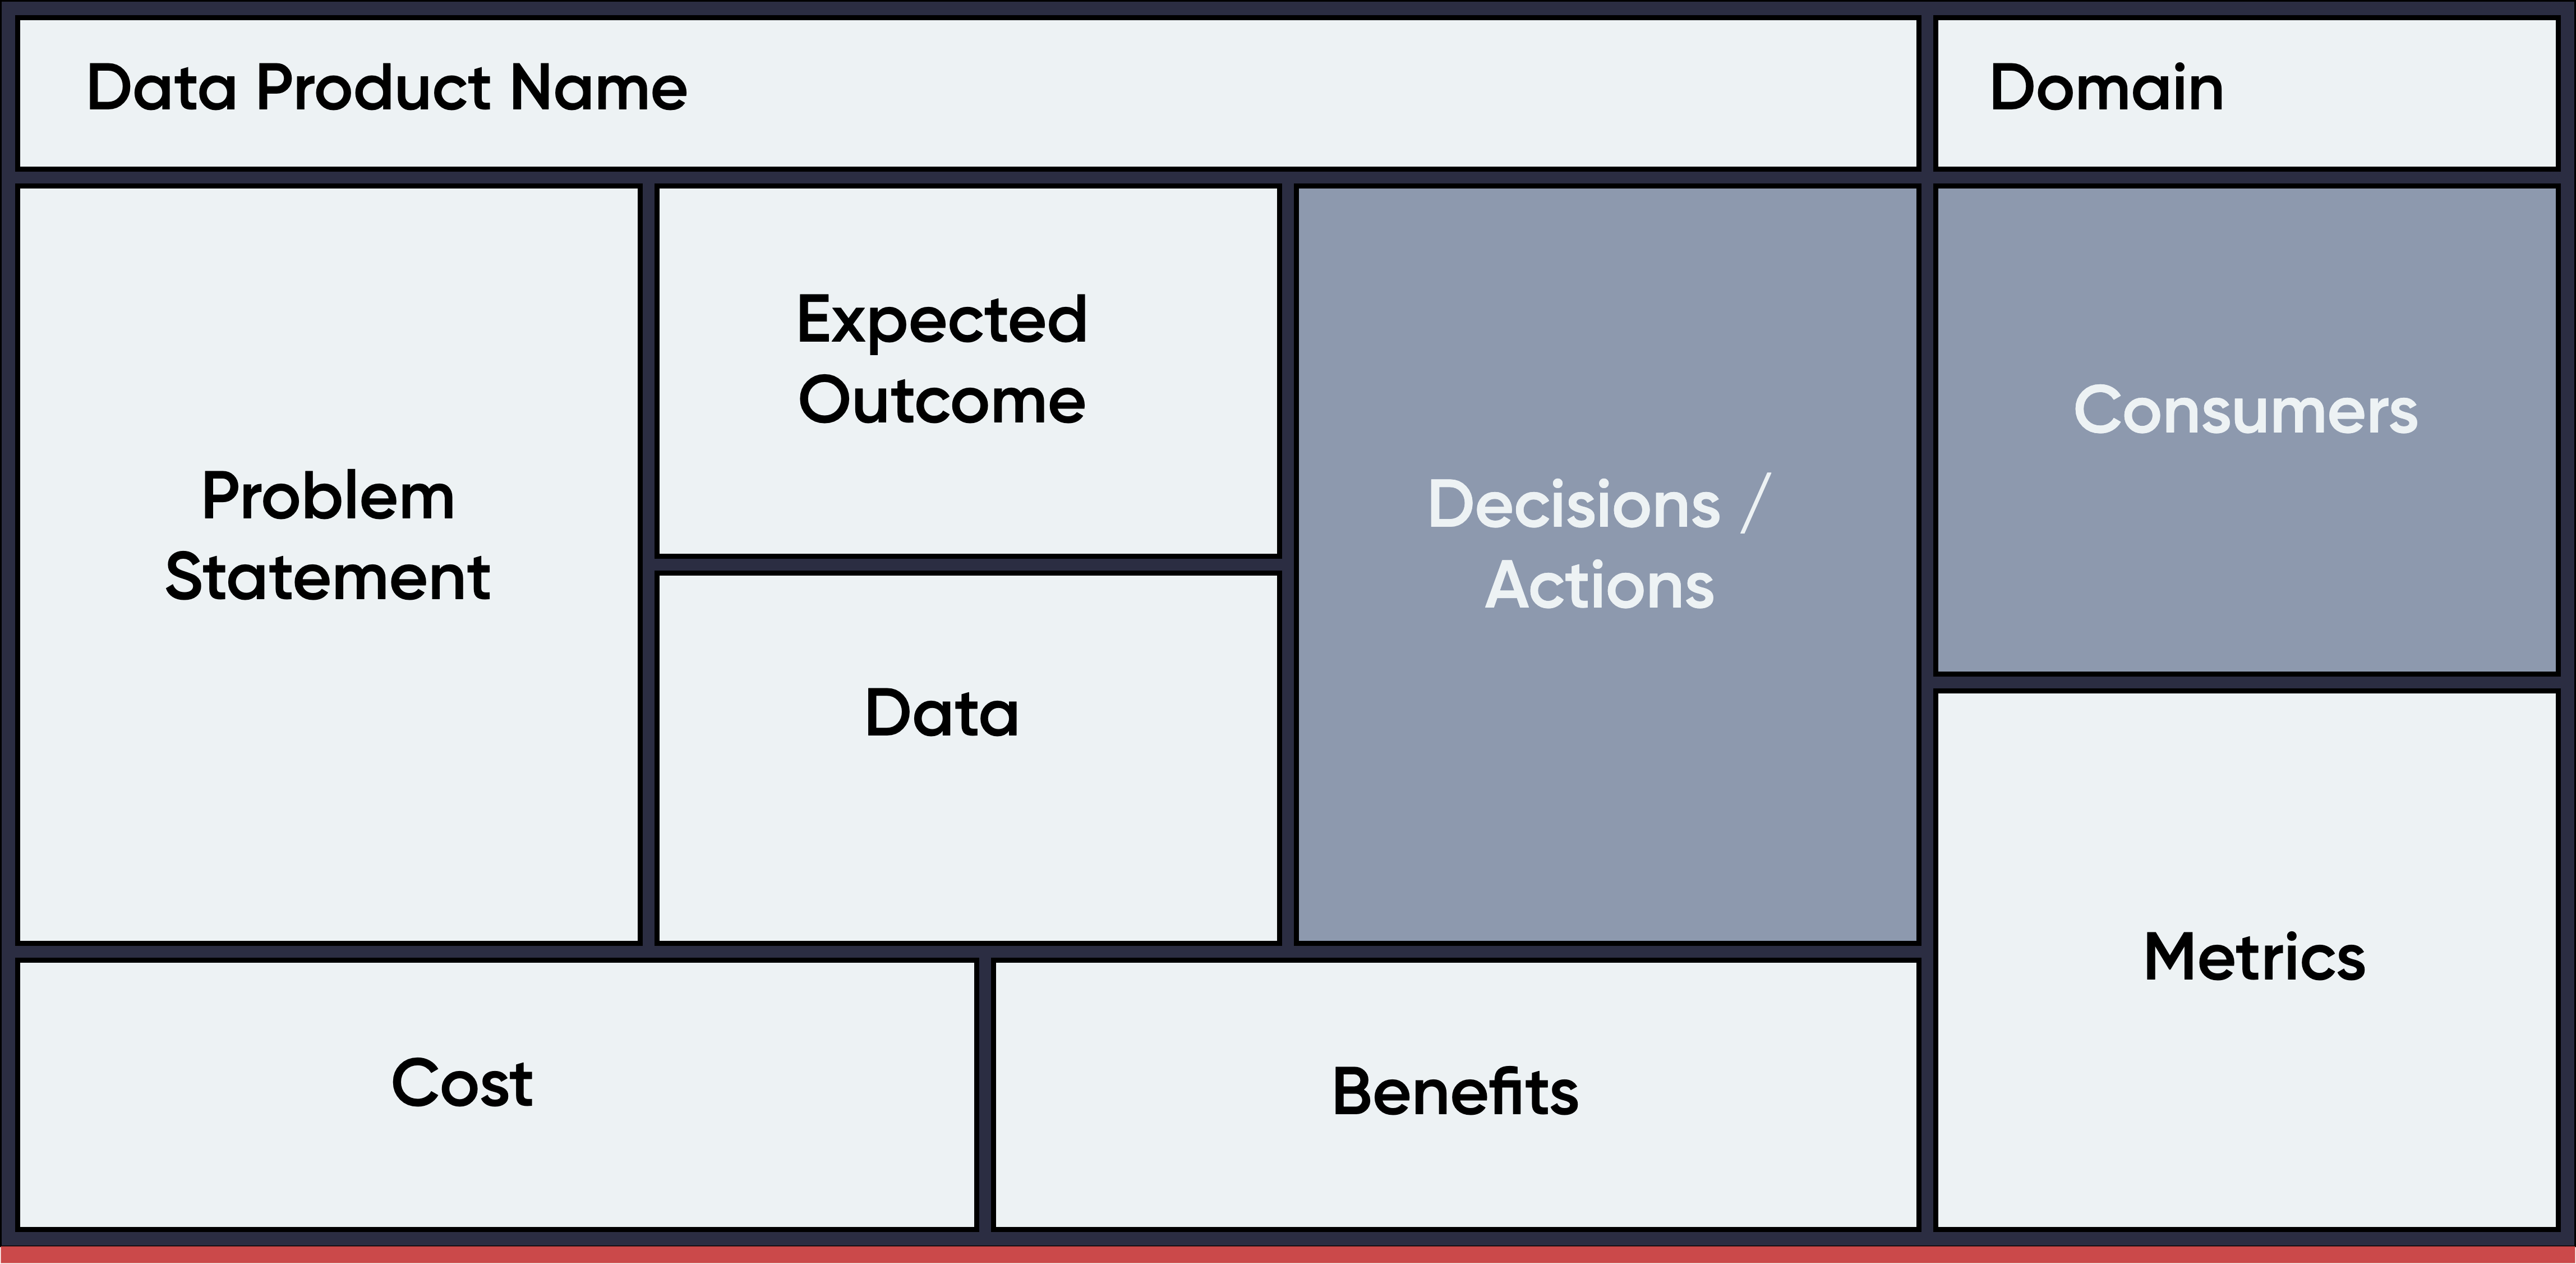
You can download a SVG copy here or the official Miro template here.
Problem Statement
It’s critical to have a clear and shared understanding of the problem that needs to be solved, and this should have been the focal point during discovery. It’s expected you would have had many problems discussed, but as you diverge to the end of discovery and synthesise all your research, you should have a defined and shared understanding of the problem statement.
Having a shared understanding of the problem statement that needs to be solved will set the foundations for a unified approach to finding a solution in the next phase.
Expected Outcome
This is not the expected solution, this is the expected outcome. You should have discussed this in-depth and how the data product will influence decisions and what actions will be taken. These actions and decisions should have an expected outcome. Having this “extremely” clear will ensure developers are guided correctly during development.
Some examples based on our fictional company.
Improved cost visibility across data domains.
Reduction in manual effort for generating cost reports.
Business users can identify areas where cost savings can be made (not just data engineers).
Data
What are the known data sources for this data product? It’s not necessary to get technical at this stage, but knowing where the data is sourced from will be extremely helpful during the next phase (and your data engineers will love you for it)
If you don’t know the source system names, it’s acceptable to define data conceptually. e.g. Customer, Location, Room, Employee.
Do you have a data Catalog implemented? Explore your data catalog to identify existing data which your data product could utilise. Knowing what data already exists can potentially influence cost and avoids data duplication on the data platform.
Cost
Costing a data product is not easy, but it shouldn’t be ignored even during discovery. It’s important to be transparent with your stakeholders on how much this might cost, and how much similar projects have cost and continue to develop5 (compute, ongoing development etc.). Consider exploring other similar sized projects to get a rough idea on potential cost, and having a ROM6 is acceptable.
Decisions / Actions
What expected decisions or actions do you see your customers making based on the output of your data product? Are the decisions and actions influencing your metrics in the right direction? These are just assumptions at this point, and experimentation and iteration will follow.
Checkout the book Analytical Skills for AI and Data Science and read Chapter 4 on Actions, Levers, and Decisions. Its covers how in business our objectives can only be achieved indirectly through actions, as intervening factors. ⭐ 4.5 read!
Benefits
What benefits does this data product expect to deliver? The benefits should address the core issues outlined in the problem statement. Examples
Better visibility into cost drivers
Directly help reduce costs or improve profitability,
Having benefits that directly correlate to the problem statement will allow you to identify the data product is delivering on its promise.
Metrics
What quantitive metrics do you need to define to know your data product is evaluating against its original targets. They are the numbers you want to consistently track and improve over time.
Ensure the metric(s) you select are meaningful and closely aligned with the objective of the data product objective and similarly, your data projects objective is aligned with a business objective.
Lastly, the metric must be actionable and controllable. You should be able to make decisions against it and control the metric to improve it. I’ll be doing a post later on just metrics using the “Goal-Signal-Metric” framework.
Example: For our cost dashboard, tracking "Monthly Azure spend by department" might be actionable, as it allows teams to identify areas for cost-saving initiatives.
Consumers
Who are the intended users of this data product? Business users? Finance? Data engineers? It’s helpful to know who your target audience is to ensure all relevant stakeholders are considered during discovery. If you have not spoken to the correct consumers, you are not applying the best product mindset to your data product and validating you are solving the right problems.
As you conclude discovery and definition and start to narrow in to the solution space, you should have a completed data product canvas and all stakeholders have a shared understanding of what the objective of the data product will focus on and the problem to which it will address. As I mentioned in the introduction, this will lay the foundations for a unified approach to finding the right solution.
Takeaways
This isn’t a recipe, it’s a blueprint or compass. Don’t follow it exactly. Adapt the parts that work for you and your team.
What we have at the end of discovery are just assumptions. Iterate, experiment and update your canvas as you learn more.
When speaking with your customers, use a product mindset. You are developing a product for them, which will require constant iterations and changes.
The data product canvas is a fluid, living artifact and should be iterated on as assumptions are validated or invalidated. Its definition and redefinition.
Finally, go talk to people. Generate insights.
If you’re reading this, I’d like to thank you for making it through the whole article! I hope to catch you in the next article “Principles & Guardrails for Building Data Products”.
https://designsprintkit.withgoogle.com/methodology/phase1-understand
Lessons from the past may not always ward off doom, but they can provide insights into the present and even the future.https://liberalarts.vt.edu/magazine/2017/history-repeating.html
Sensemaking is the process by which people give meaning to their collective experiences. It has been defined as The ongoing retrospective development of plausible images that rationalize what people are doing.” source: https://en.wikipedia.org/wiki/Sensemaking
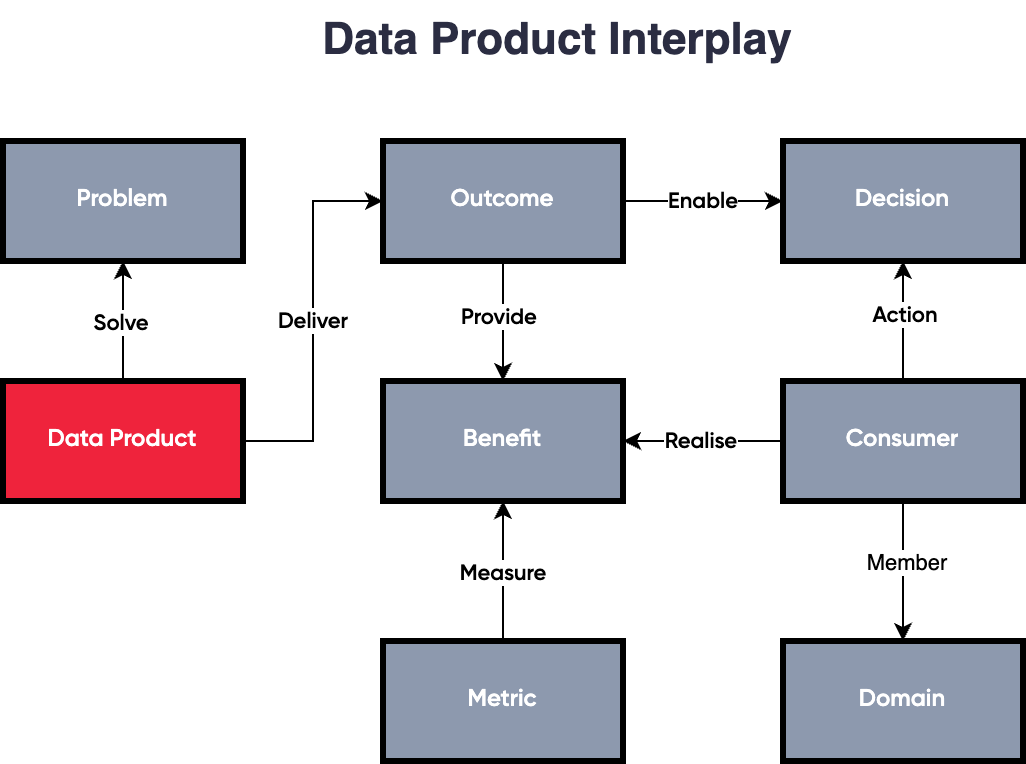
The Data Product Interplay is the relationship of all inputs of the Data Product Canvas. Its purpose is to visualise why the data is required during discovery and how it’ll enable future phases.
Avoid turning your team into a report factory where your data teams churn out reports from tickets in Jira. A huge part of developing data products is that they are treated like a product and therefore require constant iteration and improvements.
A Rough Order of Magnitude (ROM) is an estimate used in projects to provide a ballpark figure or an initial approximation of the cost, effort, or time required to complete a project. It is typically used in the early stages of discovery when limited information is available and is usually accurate within a range of -25% to +75%. It’s a hypothesis-driven guess 😊